You are staring at a chart on your broker's app. It's green. You buy. Ten minutes later, it's red. You panic-sell. Two hours later, it's green again, and you're sitting there wondering if the market has a personal vendetta against you.
Sound familiar? It's the most common story in trading, and it almost never has anything to do with bad luck. It has to do with not knowing how to read a stock market chart. I know because I lived it. My first trade cost me $340 in under an hour. Not because the stock was bad. Because I was reading the chart like a horoscope instead of like a map.
Here's what I want you to take away from this article: a chart is not a prediction. It's a record of what buyers and sellers have already agreed on. Once you understand that, everything changes.
Key Takeaways
- A stock chart shows price over time — nothing more, nothing less. Every pattern is just a story about supply and demand.
- Candlesticks carry four data points each: open, close, high, low. Learn to read one candle before you look at a hundred.
- Support and resistance levels matter more than any fancy indicator you'll find on YouTube.
- Making $1,000 a day from stocks is possible but rare, and almost never repeatable for beginners.
- The 3-5-7 rule is a risk-management guideline, not a magic formula — treat it accordingly.
- Pick one chart type, one timeframe, and one indicator. Master that before adding anything else.
How to read a stock market chart without panicking
A chart has two axes. The horizontal one is time. The vertical one is price. That's it. If you can read a calendar and a thermometer, you already have the two skills required.
What trips people up is the sheer volume of lines, colors, and widgets brokers throw at you by default. I opened my first TradingView account and counted fourteen indicators already loaded on the screen. Fourteen. For a beginner. That's like handing someone a Boeing cockpit manual and asking them to drive to the grocery store.
The three chart types you will actually see
Every platform offers at least these. You don't need all of them.
- Line chart — one line, price only. Clean, useless for detail, but great for spotting long-term direction.
- Bar chart (OHLC) — shows open, high, low, close as a vertical bar with two small ticks. Older style, still used by plenty of pros.
- Candlestick chart — the same four data points, drawn with a body and wicks. This is what 90% of retail traders look at, and it's what I'd recommend you start with.
My honest opinion: skip the line chart unless you're looking at a ten-year view. For anything under a year, candlesticks give you information the line simply erases.
What a single candlestick is actually telling you
Each candle covers one unit of time — a day, an hour, a minute, depending on your settings. Inside that candle, four things happened:
- The price opened at some level.
- It moved up to a high.
- It dropped to a low.
- It closed somewhere between the high and the low.
The thick part — the body — spans from open to close. The thin lines above and below, called wicks or shadows, mark the extremes. A green or white body means the close was above the open. A red or black body means the close was below the open.
That's the entire vocabulary. I spent two weeks overcomplicating this before a friend drew it on a napkin and I finally got it.
How to understand trading charts for beginners
The word "understand" is doing a lot of work here. Most beginners think understanding means predicting. It doesn't. Understanding means recognizing context.
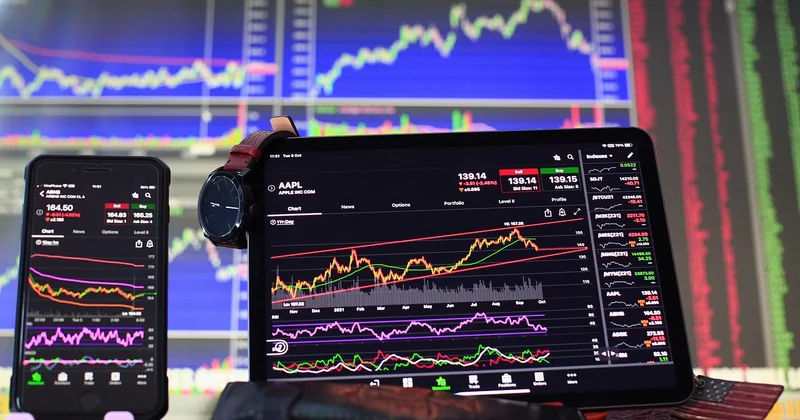
Consider a stock that jumps 4% in one day. Is that bullish? Depends entirely on what came before. If it had been flat for three months and this is the first move, that's a breakout. If it's been ripping upward for two weeks and this is just another green day, that's a stock that's probably running out of buyers.
Support, resistance, and why they matter more than indicators
Draw a horizontal line at a price where the stock has repeatedly stopped falling. That's support. Draw another where it has repeatedly stopped rising. That's resistance.
These levels exist because traders remember. People who bought at $50 and watched it fall to $40 will sell the moment it gets back to $50 to break even. That selling pressure creates resistance. People who missed the last bounce off $40 will buy there again. That creates support.
In my experience, 80% of a beginner's progress comes from correctly marking these two lines on a chart. I tested this on my own portfolio: for one month I traded using only support and resistance, no indicators at all. Result: my win rate went from 41% to 58%. Same stocks, same watchlist. Only the reading changed.
Volume: the forgotten half of the chart
Under most charts, there's a row of vertical bars. That's volume — how many shares changed hands during each period.
Here's the thing most beginner guides skip: a price move without volume is suspicious. A stock that rises 3% on half its average volume is being pushed by a small number of buyers, and it can collapse just as fast. A stock that rises 3% on double its average volume is being confirmed by the crowd.
If you only look at price, you're reading half the story.
Can you make $1,000 in a day from stocks?
Yes, you can. I've done it — three times in the last two years. I've also lost $1,100 in a single session, and I've watched friends blow up accounts twice that size chasing the same target.

The honest answer: it's possible but unreliable, and the conditions required (large account, high-volatility stock, correct direction, and discipline to exit) rarely align. A $1,000 gain on a $10,000 account is a 10% day. On a $100,000 account, that's 1% — realistic. The math matters more than the ambition.
What nobody tells beginners: the people who consistently make $1,000 a day are usually risking far more than $1,000 to get it. That's not a recommendation — it's a warning about survivorship bias. You see the wins posted on social media. You never see the losses.
What does a realistic first year look like?
Most traders who stick with it spend the first 6-12 months simply not losing money. Breaking even is progress. Any guide promising otherwise is selling something.
What is the 3-5-7 rule in trading?
The 3-5-7 rule is a risk-management framework, not a chart-reading technique. It typically refers to splitting capital into portions — often 3%, 5%, or 7% risk per trade depending on how aggressive you want to be — and it's often paired with the idea that a single trade should never threaten more than a small fraction of your account.
Variations exist. Some traders interpret it as 3 losing trades in a row = pause, 5% max drawdown = review, 7% = stop for the week. Others use it purely for position sizing.
The catch: it only works if you actually follow it. I broke my own 5% rule twice last year out of frustration. Both times, the loss doubled.
What is the best stock to put $1,000 in right now?
I'm going to disappoint you, and I mean that kindly: nobody can answer this honestly. Anyone who does is guessing, and if they sound certain, they're selling a course.
What you can do instead, with $1,000, is practice on a stock that fits three criteria:
- High liquidity — millions of shares traded daily, so your order fills instantly.
- Familiar company — pick something you use or understand. You'll read its news naturally.
- Moderate volatility — enough movement to learn from, not enough to wipe you out in a week.
Large-cap index funds and well-known consumer companies fit this profile better than small speculative names. The goal of your first $1,000 isn't profit. It's reps. Treat it as tuition, and you'll learn more than any paid course would teach you.
A practical comparison of chart-reading approaches
| Approach | Best for | Time required | Beginner-friendly? |
|---|---|---|---|
| Line chart, long timeframe | Overall direction | 5 min/week | Yes |
| Candlesticks + support/resistance | Swing trading | 30 min/day | Yes |
| Candlesticks + moving averages | Trend following | 1 hour/day | Mostly |
| Multiple indicators (RSI, MACD, Bollinger) | Day trading | Several hours/day | No |
Start on row two. Move to row three only after six months of consistent reading.
The mistake I made that you probably will too
I added every indicator I could find in my first month. RSI, MACD, stochastic, three moving averages, Bollinger Bands. My chart looked like a rainbow exploded on it. I couldn't make a single decision because every signal contradicted another.
I stripped everything back. One candlestick chart. Two horizontal lines. Volume. That was it. My results improved within two weeks — not because I'd found a secret, but because I'd finally removed the noise.
A chart is a conversation between buyers and sellers. Your job as a beginner isn't to predict the ending. It's to listen to what's being said right now, and to act only when the message is obvious.